Accounting for the bin structure of data removes bias when fitting size spectra

Accounting for the bin structure of data removes bias when fitting size spectra
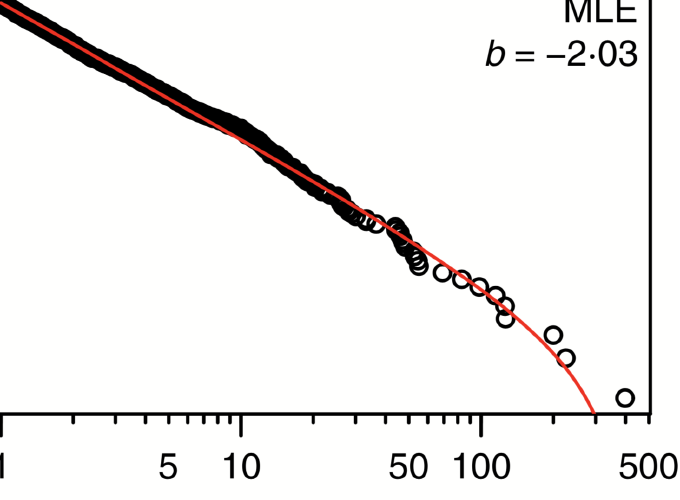
Size spectra are recommended tools for detecting the response of marine communities to fishing or to management measures. A size spectrum succinctly describes how a property, such as abundance or biomass, varies with body size in a community. Required data are often collected in binned form, such as numbers of individuals in 1 cm length bins. Numerous methods have been employed to fit size spectra, but most give biased estimates when tested on simulated data, and none account for the data’s bin structure (breakpoints of bins). Here, we used 8 methods to fit an annual size-spectrum exponent, b, to an example data set (30 yr of the North Sea International Bottom Trawl Survey). The methods gave conflicting conclusions regarding b declining (the size spectrum steepening) through time, and so any resulting advice to ecosystem managers will be highly dependent upon the method used. Using simulated data, we showed that ignoring the bin structure gives biased estimates of b, even for high-resolution data. However, our extended likelihood method, which explicitly accounts for the bin structure, accurately estimated b and its confidence intervals, even for coarsely collected data. We developed a novel visualisation method that accounts for the bin structure and associated uncertainty, provide recommendations concerning different data types and have created an R package (sizeSpectra) to reproduce all results and encourage use of our methods. This work is also relevant to wider applications where a power-law distribution (the underlying distribution for a size spectrum) is fitted to binned data.