The size spectrum describes the distribution of body sizes within a community, and is widely used among fisheries biologists to track exploitation effects and parameterise theoretical size-based ecosystem models. Most notably, empirical size spectrum estimates have provided insights into community-level changes in overfished ecosystems. In a project led by Dr. Andrew Edwards (Pacific Biological Station, Fisheries and Oceans Canada) and recently published in Methods in Ecology & Evolution, we show that empirical size-spectrum fitting methods are not standardised and many are biased.
Individual body size distributions typically exhibit power law relationships, with an exponent b that quantifies the relative abundances of body sizes. In practice, size spectra have typically been fitted by fitting a linear regression to binned abundance and body size data in log-log space, where the slope of the regression is analagous to the power law exponent. b is negative, reflecting a decrease in abundance as body size increases, and is said to ‘steepen’ (or decrease) when fishing pressure is size-selective and large-bodied fishes are removed from the community. We tested the accuracy of different fitting methods including binned vs. unbinned data and regression vs. power law distribution fitting.
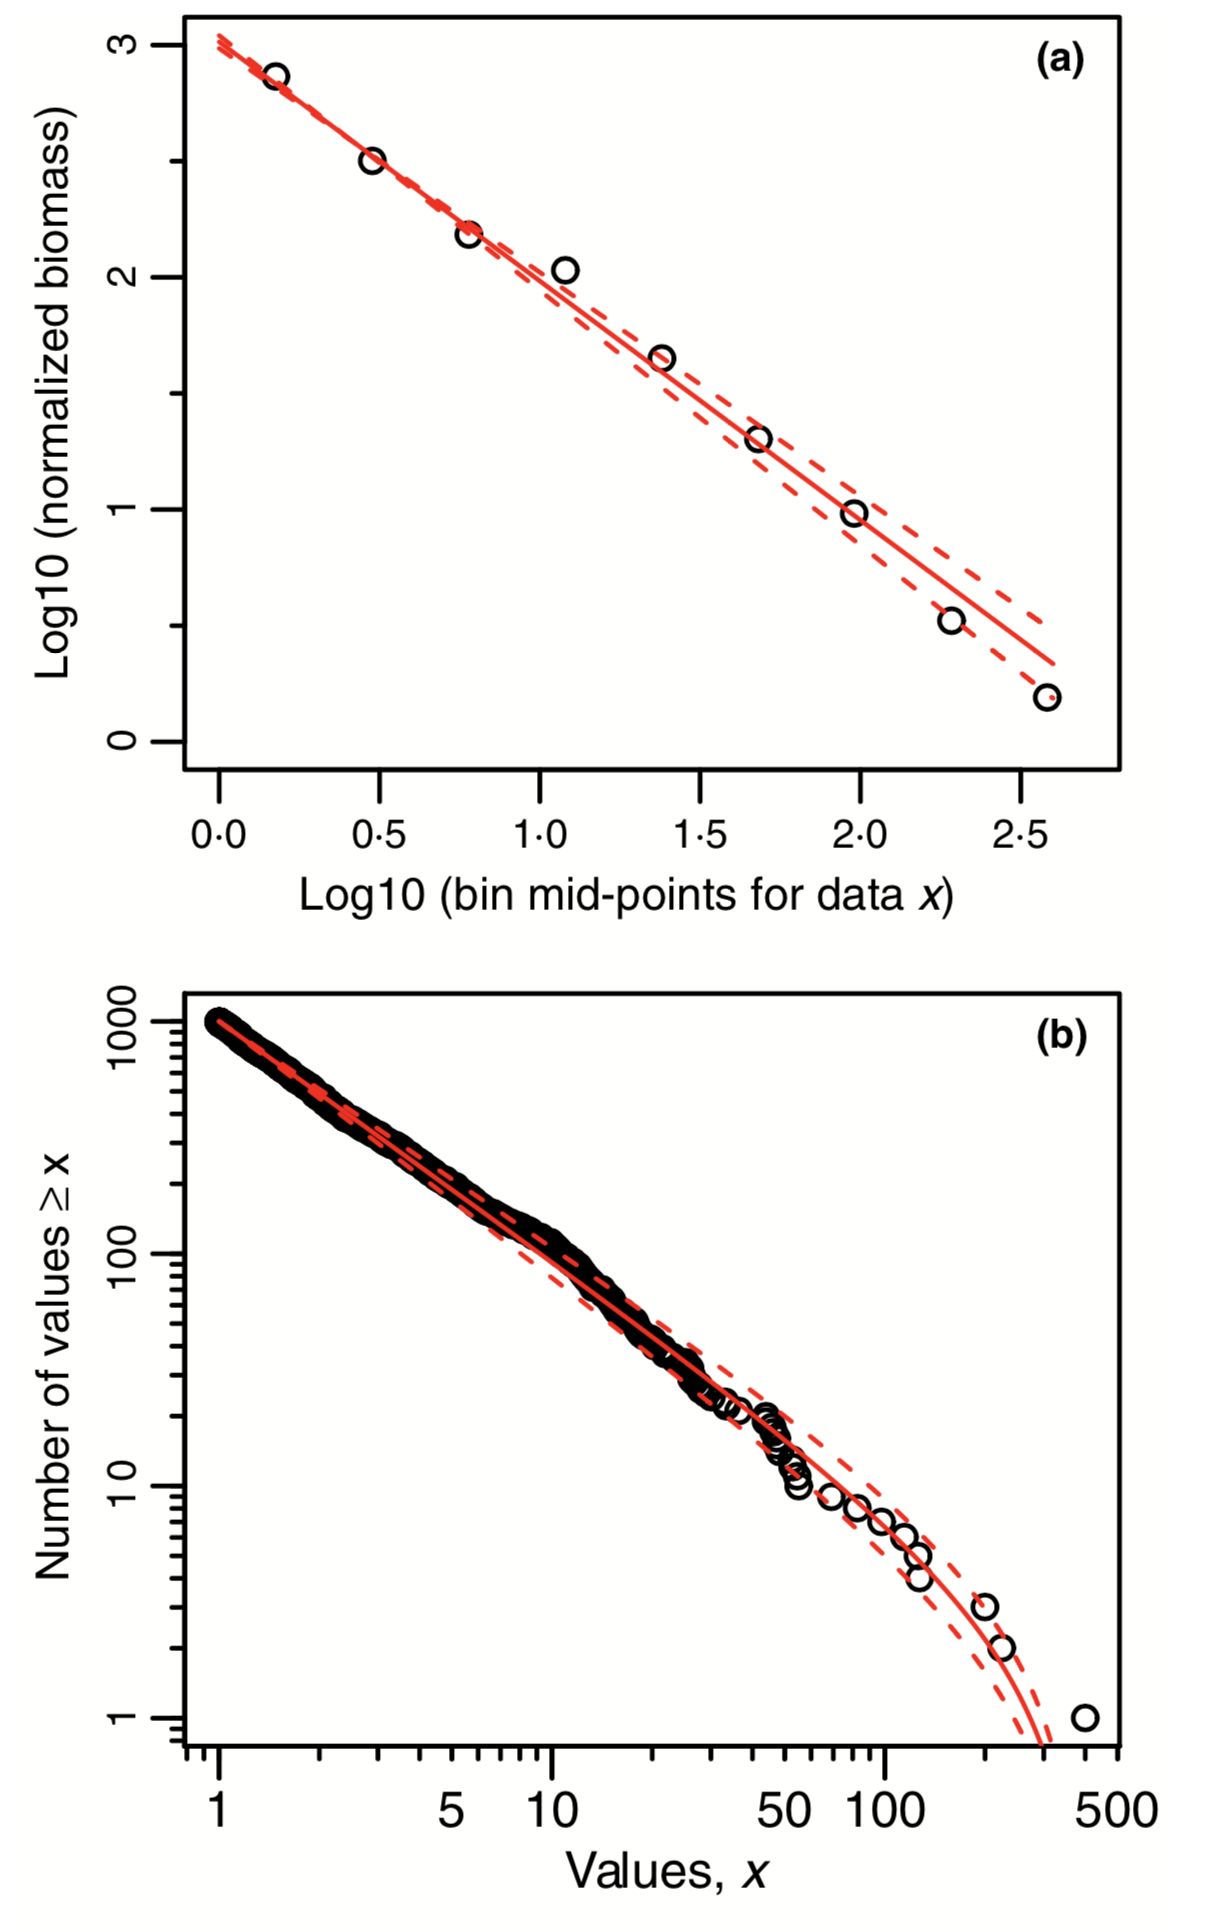
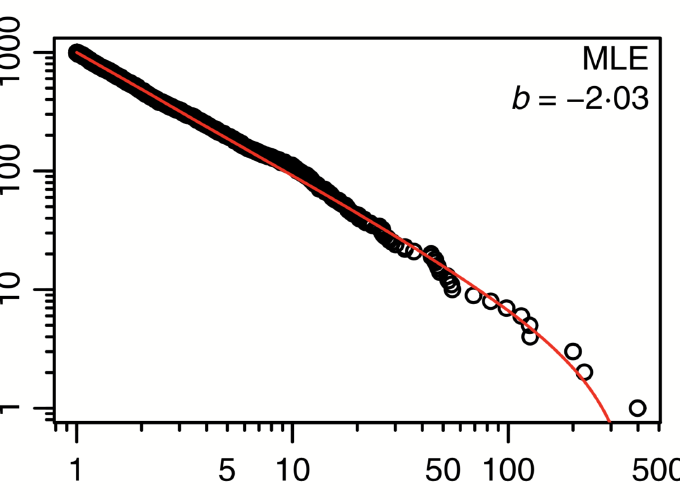
Our results indicate that maximum likelihood estimation of power law distributions gives the most accurate estimates of size spectrum exponents (b estimates). We provide code for maximum likelihood estimation of binned and unbinned body size data, and also recommend that size spectra are presented by plotting both a log-log biomass spectrum and an untransformed abundance spectrum that allows visual inspection of every data point (Figure 1).
We hope that fisheries biologists will use these tools to improve their analyses of community size spectra, and that our work has improved the utility of size spectra as indicators of ecological change. The published paper is Open Access and can be downloaded from Methods in Ecology & Evolution.